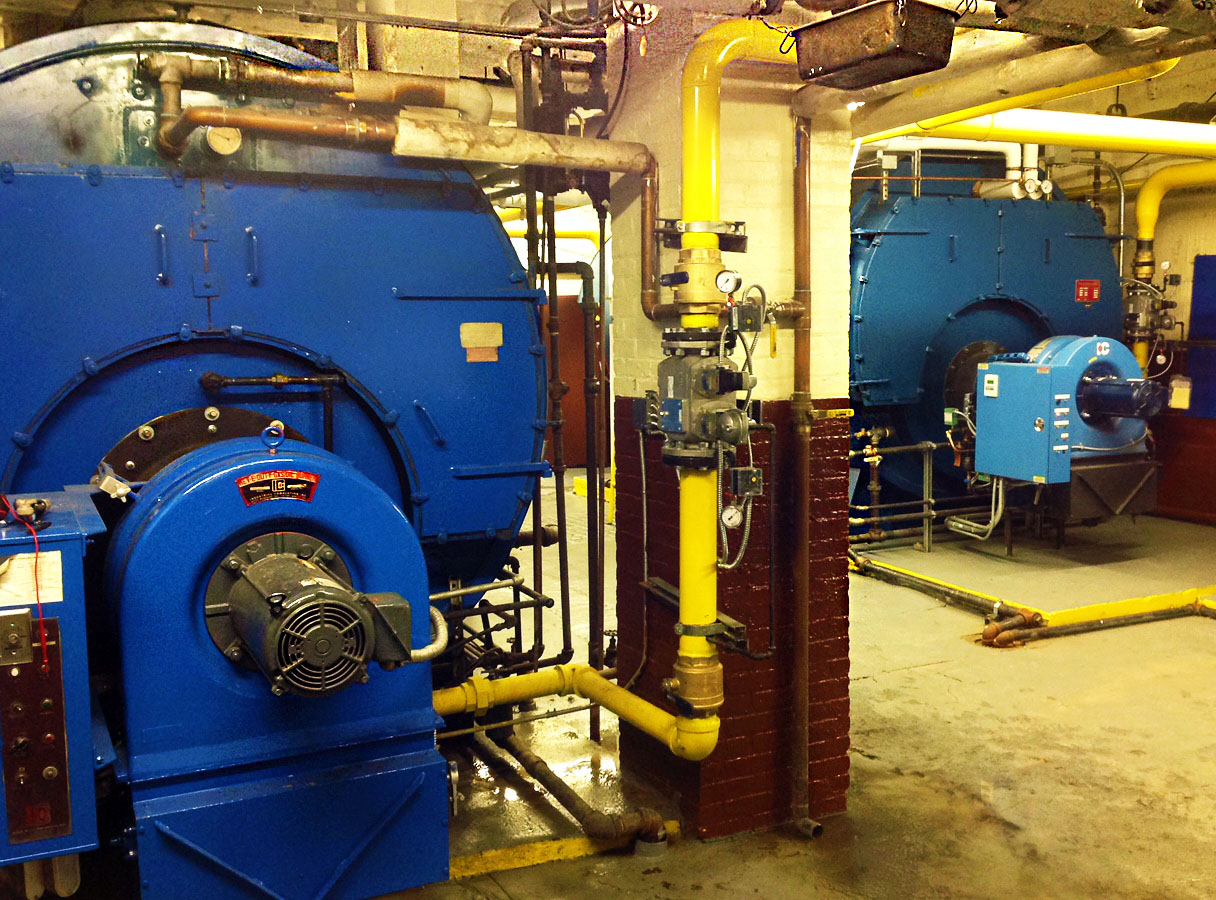
What Exactly is Boiler Horsepower (BHP)? By Luke Wonnell In the United States, the output capacity of steam boilers is expressed as Boiler Horsepower (BHP) whereas hydronic boilers are typically sized based on their input capacity in Btu’s/hr. There are definite differences between these two methods, but it is possible to convert between the two units of measure. 1 […]